Bitcoin (BTC) closed the week down at $6,900 having lost around $1,400 or 18.72%. Monday got off to a disastrous start for the bulls, with a selloff in the Asian market session, losing another 5.5% finding lows of $6,500 before the bulls responded with a 13% swing back over $7,300.
As has been witnessed recently, Bitcoin has continued to dictate the valuation across the cryptocurrency market as a whole. Notably, Ether (ETH) briefly traded around $130, but has since recovered and is now attempting to retake $150, up around 6% for the day.
Bitcoin dominance continues to attempt retaking 70% and looks likely to do so in the near future.
With volatility returning to the BTC market, we will take a look to see if this is a relief rally or if there are signs that this is more of a pivotal moment for the number one crypto asset.

Cryptocurrency market daily view. Source: Coin360
Weekly chart

BTC USD weekly chart. Source: TradingView
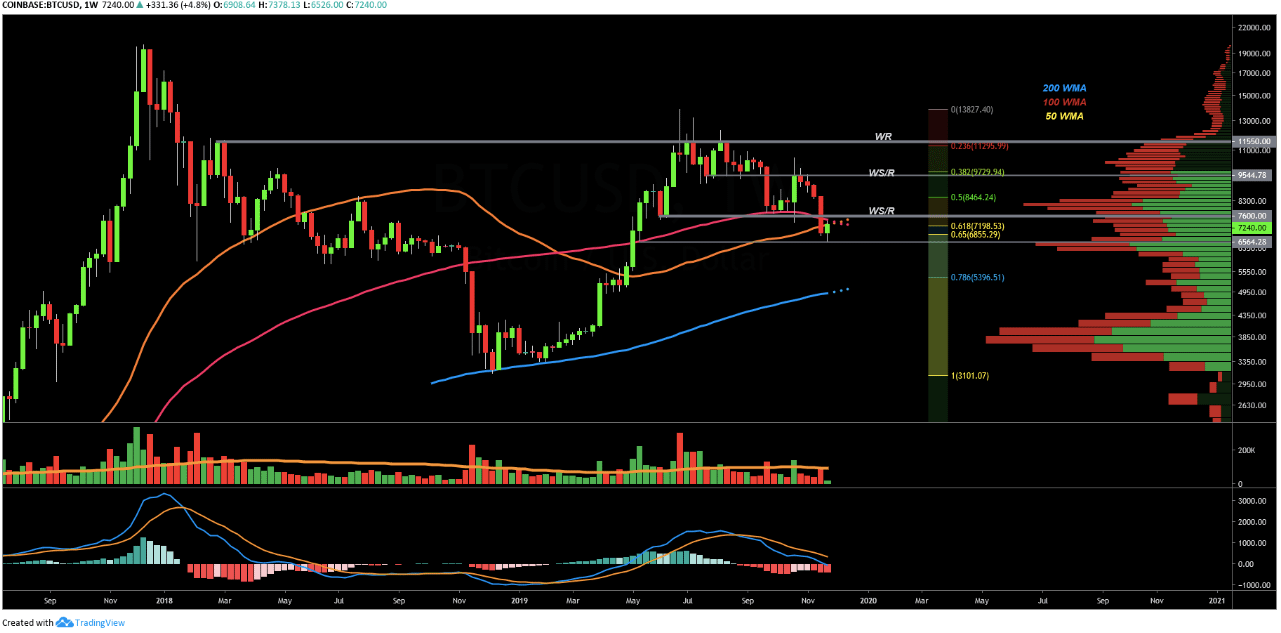
Bitcoin failed to close the week above the 100-week moving average of $7,400, which has typically spelled trouble for the price of Bitcoin. The 100 and 560-week moving averages are due to cross bullish next week and often price does reverse into moving average crosses, so it is not unusual price action being witnessed.
Price has ultimately found support at a previous highly traded volume node on the Volume Profile Visual Range, or VPVR, just below 65% of the retracement from the 2019 highs of 14K.
The bounce has also come from around the same price point that saw a very strong reaction back in May 2019.
The Moving Average Convergence Divergence indicator, or MACD, still implies that there is bearish momentum. Selling volume was above average last week and the price is trading below the 100-week moving average. So looking at the higher time frames, one would be forgiven for concluding that the outlook remains reasonably bearish.
Daily chart

BTC USD daily chart. Source: TradingView
The daily chart is a little more useful in identifying the trend in the price of Bitcoin. It is evident that Bitcoin has bounced off the same $6,500 level as occurred in May. But additionally, Bitcoin has apparently found support on the diagonal channel in which it has been trading for almost 5 months.
This support appears to be backed up by a bullish divergence on the daily chart. This is identified by the On Balance Volume (OBV) indicator printing a higher low, whereas price has printed a lower low. This is suggesting that the selloff is being powered by diminishing selling and that there is hidden accumulation.

BTC USD daily chart. Source: TradingView
The support found at $6,500 is encouraging for the bulls. But there remains a bearish case that the technical target of the descending triangle is yet to complete. So there is a possibility that Bitcoin will need to do more business in the $6K price region.
The most bearish immediate outlook at the moment would be $6K failing to act as support and a fast fall to retest the 200-week moving average, currently around $5,400
4-hour chart

BTC USD 4-hour chart. Source: TradingView
Looking at the 4-hour bitcoin chart as an immediate guide for how the rest of the week may play out, it’s clear that Bitcoin has run into some resistance at $7,400, in the vicinity of the 100 WMA.
Breaking and closing the week above this level is the main task for the bulls this week.
There is also a clear OBV confirmed divergence on the 4-hour chart, a possible strong sign of a least some attempt by the bulls to continue the price appreciation; this would also be supported by a bullish divergence and cross on the 4-hour MACD.
Market sentiment

BTC USD 4-hour chart. Source: TradingView
A look at sentiment in the market shows that Bitcoin funding is negative in the perpetual swap markets. Sustained periods of negative funding has previously had an inverse relationship with the direction of the price and, thus, supports the bullish case.
The same sentiment extends to the futures market where it is clear that the speculation over the strength of Bitcoin’s futures premium dropped to lows witnessed during previous corrections and bottoms.
Additionally, the fear and greed index has dropped to new lows with the market being in extreme fear suggesting that some of the weaker market participants are giving up hope — a good sign for the contrarian traders.

Fear & Greed Index. Source: alternative.me
Summary
Overall, the price of Bitcoin has again responded positively following a selloff. There are underlying signs of a case for a bullish reversal going into the year. But for the bullish scenario to proceed, Bitcoin would need to regain the 100-week moving average at around $7.4K in the near future.
Failure to do so will mean that Bitcoin potentially needs to do more testing of the bulls in the $6K range. A lack of response here would potentially lead to a much bigger decline and test of the 200-week moving average.
The views and opinions expressed here are solely those of the author and do not necessarily reflect the views of Cointelegraph. Every investment and trading move involves risk. You should conduct your own research when making a decision.
from Timor Invest https://ift.tt/2Ol4l18
Комментариев нет:
Отправить комментарий